Subjective probability and crowd accuracy in historical price prediction
Read the Tape is a daily chart reading game at readthetape.cc. The platform presents five real S&P 500 charts each day, with tickers and dates hidden, and prices normalised to 100. Players must call whether each chart rises or falls over its next five trading days. A stated confidence level, low, medium or high, sizes a paper money bet which is Brier scored. All players receive the same five charts each day, which allows for direct comparison of subjective probabilities across a uniform set of historical price series.
On July 10, one chart showed a 21 percent slide over roughly three months of trading. Out of 476 players who called this chart, 67 percent went short. The crowd expressed its highest average confidence of the day on this specific chart: 74.9 percent, compared with 71.2 to 71.7 percent on the other four charts. The other four charts that day were called roughly as coin flips, showing 47 to 61 percent splits. The chart was Qualcomm, November 2018, representing the capitulation low of the rate scare selloff. Over the next five trading days it gained 1.4 percent, and it has returned 359 percent from that point to today.
Calibration details
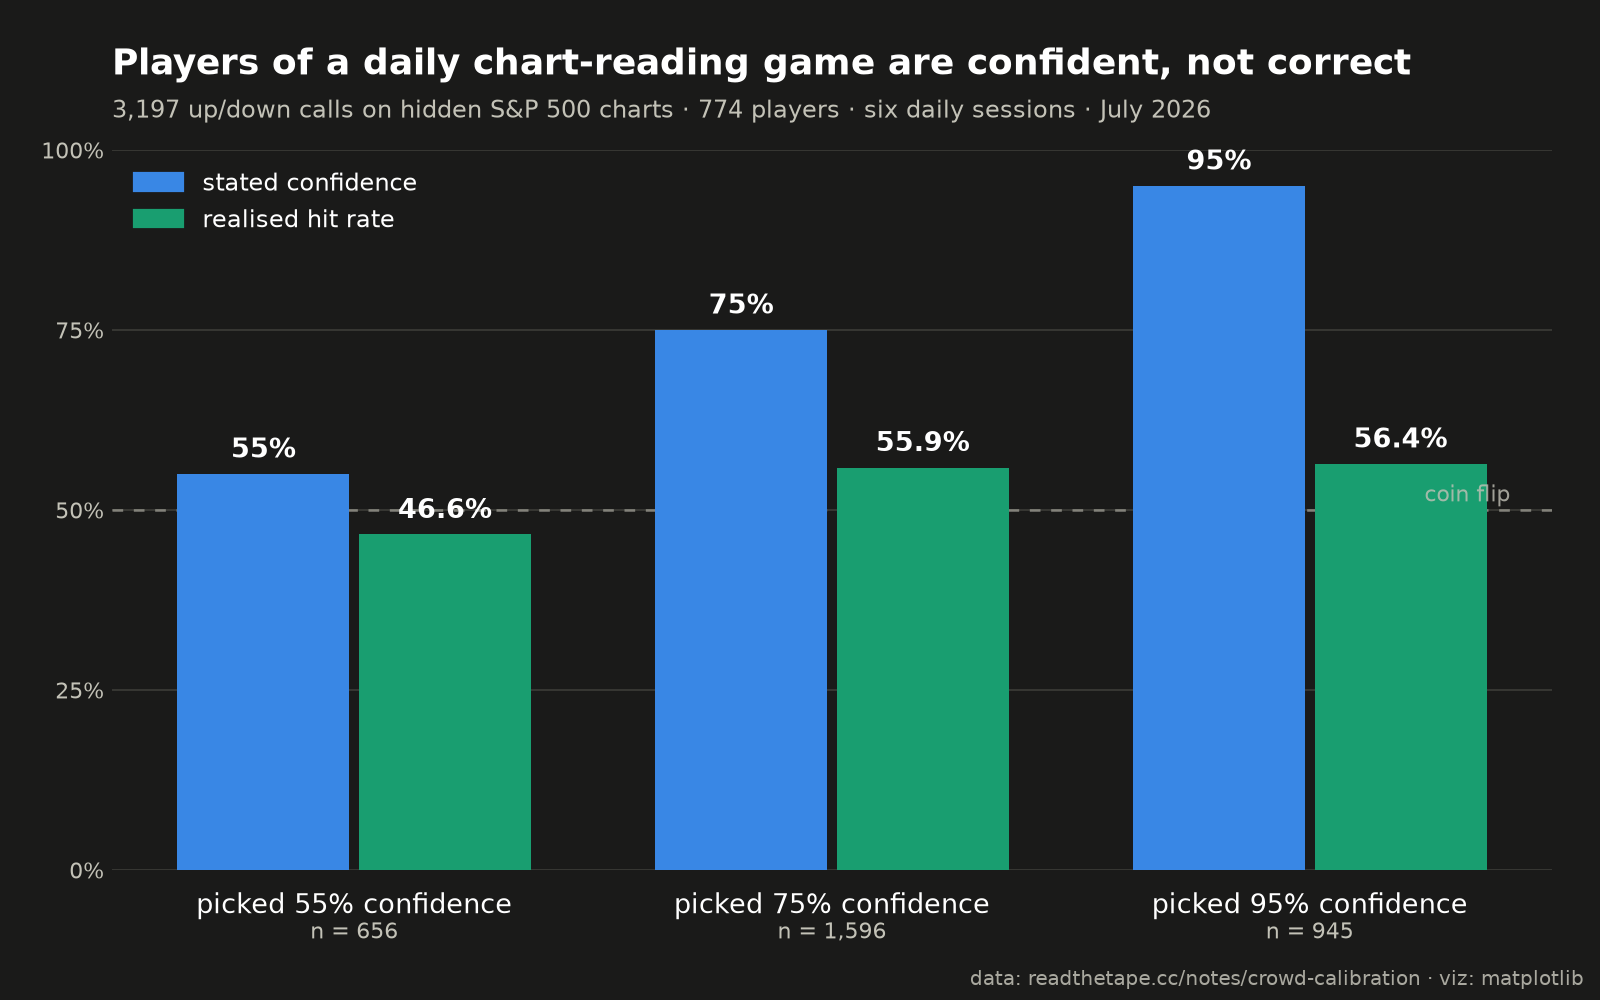
Across six daily sessions so far, 774 players have completed 3,212 scored calls. The aggregate calibration data shows a pronounced gap between confidence and performance: the average stated confidence was 72.8 percent, whereas the realised accuracy was 54.2 percent. The breakdown of calls by confidence interval shows that even when players are near certain, accuracy increases only marginally. Under the staking rule, 95 percent confidence represents an all in bet.
| Confidence interval | Scored calls | Hit rate |
|---|---|---|
| 50-59% | 656 | 46.6% |
| 70-79% | 1,596 | 55.9% |
| 90-95% | 945 | 56.4% |
Caveats
Several caveats apply to these early findings. The dataset represents only six days of data from self selected players. The chart windows end at least one year ago, which excludes recent market regimes. Furthermore, directional accuracy on a five day horizon is expected to be close to a coin flip. The primary point of interest is not the raw accuracy, but rather the persistent gap between the average stated confidence of 72.8 percent and the realised accuracy of 54.2 percent.
The game resets at midnight UTC, is free, requires no signup, and is available at readthetape.cc.